

"You're capable of using your yield monitor to measure,
do trials and check if your plan actually worked.
It's so much easier than it used to be." - Dan Frieberg
RENEE HANSEN: Today, we’re talking with Dan Frieberg, and we're talking about yield monitors and how Premier Crop can help support a grower while utilizing their yield monitor. Dan, can you just explain a little bit about how growers can notice differences in the field, whether it's a good spot or a bad spot?
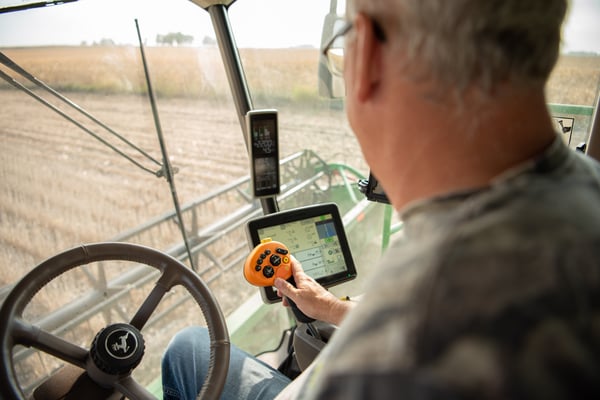
DAN FRIEBERG: What's happened over the last 22 years, since we've been in business, is yield monitors have become really commonplace. Almost every combine now would have a yield monitor, but, Renee, a lot of growers don't really use them very effectively. It's almost like some people use it just as a way to measure moisture, to keep track of moisture and direct grain. It's where the grain is going based on moisture. Somebody else described yield monitors as "Harvest TV." It's just something they look at as they go through the field. Renee, I would tell you that every grower has seen 90-bushel beans, and every grower has seen upward to 250-bushel to 300-bushel corn in some part of the field. They've seen those numbers flash in good years. They’ve seen those numbers flash on the yield monitor. And, for me, if I'm a grower, what I want to do is, if I had the time — I mean, if it weren't so rushed in harvest — I would love to stop the combine and figure out what in the world is going on in that part of the field. What makes that part of the field so much more productive than the rest of the field?
When they go through the really low-yielding parts of the field, generally, they have an idea already. They remember the growing season. They saw that area. It had weed escapes, or it was moisture-stressed. So, a lot of times, they know because of soil differences. They know the lower-yielding areas. Sometimes, though, with the super high-yielding areas, they're unsure. They know their sweet spots in the field, but they don't know what makes them a sweet spot. So, one of the foundation pieces that we like to do with yield monitor data is just put that data file, the yield monitor data file, together with a whole bunch of other layers of data and really try to help the grower see the differences in the field beyond. The yield monitor tells a story, but you really don't get the complete story until you combine it with the rest of the data. So, for us, it's a big foundational piece, but a lot of growers aren't using their yield data. I think it's just because nobody's ever led them to understand how they could use it, all the different ways they could use the yield data to their advantage.
RENEE HANSEN: I was riding in the tractor earlier this fall with my husband, and his dad was running the combine. His dad was seeing 90-bushel beans, and the field actually ended up doing record-high soybean yield in his lifetime. And he's 73, and he's never seen beans that high. And so, you mentioned you would want to stop. What would you do if you weren't so rushed? What would you do to stop and look at, when seeing the yield monitor hit 90 in beans?
DAN FRIEBERG: For me, Renee, a lot of times, it's what's below ground. I want to know what is different about that area. And, most of the time, that difference is underground. It's a combination of what you might learn off of a soil test. It could be soil-type related. Sometimes, it's really hard to understand. What we try to do, though, is identify those consistently high-yielding spots. Year after year, there's something about that area. A lot of times, Renee, the topsoil is deep there. What's called the A horizon, the very first layer of topsoil, that is really deep there. The reason I know that is because, in a dry year, they have enough topsoil that they have enough water holding capacity in that area of field to carry it through a dry year. They also tend to be well-drained because, in a wet year, the water is not going to stand there. So, they're well-drained because of natural slope, or they're well-drained because of soil structure. Or they could be well-drained because of tile, but they tend to be well-drained, as well. So, I automatically know those two pieces usually fit together. In those areas, you're not hitting the clay layer right away. You have enough topsoil to carry it through the dry year.
For us, those areas just beg. They beg to be managed more aggressively. There's a lot of growers who — just in general, we climb, in yield, a couple of bushels on corn, maybe a bushel on soybeans. Just nationally, we tend to be on this upward trend over the last 20 years. We try to talk to growers about how, if you’re going to take the next leap, if your farm average — let's say your farm average on soybeans this year is 65, and you want to move your farm average to consistently above 70, don't the best areas of your field have to get in the 90-bushel range? If you're going to climb five bushel across your entire operation, I'm guessing the best areas have to do more than five bushel because the worst areas, they may be maxed out already. So, climbing up, being able to continue to climb overall yields, it probably means the best areas have to do even better. We just love to use the yield file as a way to quantify those areas. And then those become areas that we’re just much more aggressive, much more aggressive with everything, to try to take them to that next yield plateau.
RENEE HANSEN: You also mentioned utilizing more than just this year of yield files and using more historic yield to layer more years of yield and data. So, why would that be so beneficial to utilize your yield monitor, to continue to put in all these years of data? Because the grower already has it, they have years and years of data, probably on a jump drive or maybe in the monitor. What can they do to utilize all of those years, and how easy is it to get it into a system like Premier Crop?
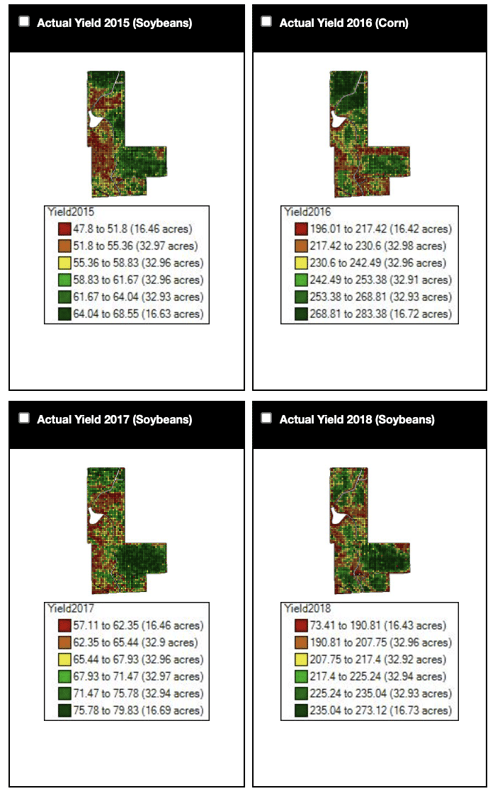
DAN FRIEBERG: We try to make it as easy as possible. We love to grab that historic yield data. If there's one piece of data that growers have a lot of, a lot of times, it's historic yield data, and it's exactly like you just described. It's on thumb drives in a desk drawer. Who knows where it is, but the grower knows. It could be in a Ziploc bag, and it's just a combination of all these different devices they've had over the years. But we just love to grab it because it starts to let you see spatial differences, differences within the field and consistent differences. If you have more than one year, the reason you want to look at more than one year is just to be able to see consistency over different weather patterns.
There are always outliers in data. Yield files aren't perfect because there can be man-made differences in a yield file, meaning, for example, you could have a hybrid or variety change that creates an artificial. Like one variety fell out of bed and just didn't do well, and that area of the field looks bad, but it had nothing to do with the area of the field. It had everything to do with the genetic issue. There's always an outlier, so the more years of yield data, the more you can sort out the outliers. You can sort out the year that had the windstorm or the year that had the hail event or whatever. It lets you have more — the more years, the more confidence.
RENEE HANSEN: Yeah, you make a great point, too, that it's not only about the yield monitor, but it's also about what you can visually see. Can you talk about a little bit of the myths of the yield monitor? I feel like some growers just may not trust what is coming off of their yield data.
DAN FRIEBERG: I say all the time, if I'm a grower, and I'm 10 years into this yield monitor thing, and I've never used my yield data to make a decision, pretty soon I quit caring. Why would I calibrate my yield monitor when I've never used it? I mean, I've never really used it.
RENEE HANSEN: It’s like not having a score at a sporting event, like who's going to care who scores next if you can't see the scoreboard? Nobody knows. You need that score.
DAN FRIEBERG: That’s where we’re at. What we find is that the same grower who hasn't cared about calibrating their yield data, once we start working with them, and they actually start seeing why it matters, then, all of a sudden, they care a lot. And then they calibrate, and then they really do pay attention. Then, Renee, it almost is like the switch goes on, and then they want everything to be perfect. If the grain cart scale says that field did 83 bushels, they expect us to adjust the yield file to an average of 83 because that's what the grain cart scale said. Once they start actually using the yield monitor to make decisions, then they care a lot about data quality, and data quality is a big deal to us. It's just getting it right, getting all pieces of it right. Making sure that everything is right is a big deal. So, yield monitors, once they start understanding that, then one of the things that I love is, with yield monitors, we've entered this era. It's no longer: “Trust me, this works.” If you're a grower, you get sold a lot of stuff. Somebody is always driving up the driveway to sell you stuff. It's different hybrids or varieties. It's different crop protection plans. It's nutrients. It's additives. It's micronutrients. It's biologicals. It never ends. It's always this one — here's the next thing that's going to be this magic bullet.
And now, because of a yield monitor, you don't have to just trust that it works. You can actually do trials in your own fields. One of our sayings is: “Growers say local data is best, but you can't get more local than my fields.” And that's what you're capable of doing now. You're capable of using your yield monitor to measure, to do trials and measure whether each of those things actually worked. It's so much easier than it used to be. I grew up in the day of weigh wagons, where you'd go measure out a strip in the field and grab a weigh wagon comparison. That was the early years, but now it's just so easy to do the same thing at the speed of farming.
RENEE HANSEN: You said that was the early years of weigh wagons. I don't feel like I'm that old, Dan, and I feel like we were just using them 20 years ago. It doesn’t feel like it was that long ago, hauling them around in the pickup. But you also talked about it with yield monitors. And, like I said, my husband, when we were farming his field, his overall field had a record soybean yield. But why is it so important to not look at the whole field average and look deeper? I mean, you talked about it a little bit before in those parts of the fields, and I feel like that's where Premier Crop really differentiates itself.
DAN FRIEBERG: Growers are seeing really huge swings between fields, right? So, one field does really great, and another field doesn't. You can start to use your data to sort out why, but, even within fields, within a field, most of the time, there are just pretty dramatic differences. Another way we use the yield file is we use the yield file as part of future nutrient applications. You can calculate nutrient removal off the yield file and build that in. It's not the sole — we're not talking about using the yield file as the only source of how you do nutrients, but it can be another layer of data. And growers are really in tune with this. You're putting back what you took off, right? If you use the yield file, instead of treating the whole field — like if you know the field average was 85 bushel of soybeans, instead of just putting back removal for 85 bushels on every acre, using the yield file, some of the field will get 60-bushel removals, and another part of the field will get 100-bushel removals. That's really important because those high-yielding areas are removing more nutrients. And so, you need to be able to capture that in some way to make sure that you keep pace with just how much they're removing.
RENEE HANSEN: Because, ultimately, that helps them profit more because they're applying nutrients in parts of the field where they need to apply them more and less, therefore, generating consistently higher yields. Like you said, what was the percentage year over year?
DAN FRIEBERG: What we try to do is we try to put people on a steeper curve, a steeper improvement curve. Across U.S. agriculture, we continually step up yields every year, on average, if you do a trend line, which is what economists do: the trend-line yield. There are ups and downs within the trend line, but the trend line might be two bushel per acre per year on corn, or three bushel per acre per year on corn. And we're just trying to be on a steeper trend line. We're trying to use data. Instead of two-and-a-half bushels per acre per year, can we make it a consistent six bushels per acre per year? And really, Renee, it's not about higher yields. It's about higher profit. Yields are a huge piece of that. It's hard to improve profitability without doing better, yield-wise. It's all with an eye for what you just said. It's just about investing every input dollar within the field to try to get a higher return.
RENEE HANSEN: Yeah, try to get a higher return with what they already have, with what growers already have. With what I have, I need to make more. I need to profit. I need to make more margin. Utilizing that yield monitor a little bit more than just, like you said, watching it throughout the field can really be beneficial to a grower's operation.
DAN FRIEBERG: Renee, I know not everybody is wired the same, but I'm a big “why.” I always want to know “why.” Like when I see differences, I want to know what can explain the differences. For me, that “why” question is not — you can say, well, it's mother nature, but it's like, no. No, mother nature affected the entire field the same, but there's some reason why parts of the field are better and parts of the field are worse. The quicker we can define “why,” or the better we can understand “why,” if we can, then that leads us to be able to develop a plan on how to do it better. We talk all the time about “we.” What we do is we analyze. We analyze data, and then we turn that into advice. And then we act on the advice the next crop year. It's this constant cycle of driving for improvement.
RENEE HANSEN: Well, thanks, Dan. In closing, what would you say to a grower who isn't utilizing some kind of system like Premier Crop with their yield data? What would you say to them?
DAN FRIEBERG: Don't give up. I mean, some people, they literally are giving up, or they're cynical or whatever. I would say it's never too late to get started, obviously, and your yield files can be eye-opening in a way to do better. They’re a foundation piece to do better.
RENEE HANSEN: There's always an entry point to get started and, sometimes, it's just taking that first leap. Thanks for listening to the Premier Podcast, where everything agronomic is economic. Please subscribe, rate and review this podcast so we can continue to provide the best precision ag and analytic results for you. And to learn more about Premier Crop, visit our blog at premiercrop.com.