

Sometimes “averages” can be your worst enemy.
Everyone has heard far-fetched examples that illustrate the problem with “average.” Picture standing with one foot in ice-cold water and the other foot in steaming-hot water – the average of the two is OK. Sometimes that’s what using averages can do in your farming operation.
An example would be using average as you consider your fall nutrient budget. Tighter, even negative, margins will cause many to scrutinize input spending this crop year with much more intensity. Unfortunately, too many suppliers will simply calculate the most nutrients that can be applied for your per-acre budget and apply those rates on every crop acre. For all the headlines about precision agriculture, the majority of nutrient applications are still the same blend applied across every acre.
Agronomically, a better answer is to focus your input dollars in the site-specific areas of individual fields that will provide you with the most economic return on your nutrient investment.
At some point in our farming history, all of us have seen a nutrient response curve. Applied nutrient response curves tend to have these similar characteristics – steeper at lower levels and flatter at higher levels. For example, most of understand that generally we get more yield response for the first 50 pounds of nitrogen applied than the last 50 pounds. Finding maximum economic return is the basis for nutrient response curves.
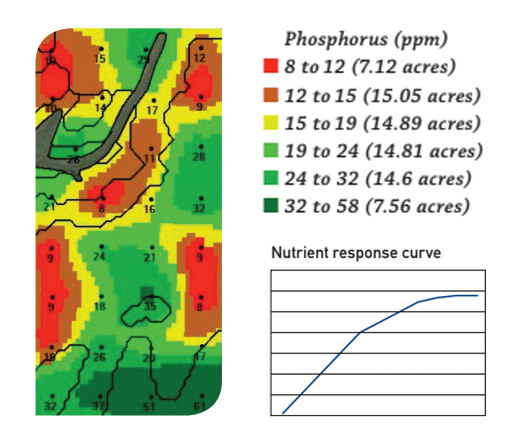
Think about response curves as you review the soil test phosphorus map above (expressed in parts per million – double the numbers if you are used to pounds per acre). If you composite-sample this field, the average is 20 ppm of P – running parallel with many university threshold levels where a response to applied P can be expected.
Using university recommendations as a reference, virtually any type of georeferenced soil sampling will reveal that in this field, spreading the same rate of P on every acre will result in no yield response is 50% of the acres (the green part of the map). As bad as that might seem, there is a decision even more economically harmful. Making a decision to not apply any phosphorus because the field’s average soil test level is 20 ppm would likely result in lost yield in 50% of the field (red, orange and yellow areas).
None of us can control or even predict all the curves of Mother Nature can throw our way. But using data from your fields opens the door for you to manage the crop production variables that are manageable. The fall’s tight economics area great time to put all your data to work – to stay away from averages. If you don’t have school data, now is the time to get started. The cost of a good grid soil sample spread over the normal four-year life equals less than one-third of 1% of your production cost.
Collecting and using your data can move you away from defaulting to using averages and getting average results.