

As farmers face another year with challenging markets and high inputs, we as agronomic advisors continue to work with our clients in order to find where we can remove some of the guessing when it comes to the decision-making process of planning another season. It comes as no surprise to anyone that is involved in Agriculture that many areas saw higher than normal precipitation in 2018.
The map below shows the state of Iowa and the departure from normal in inches of rainfall in 2018.
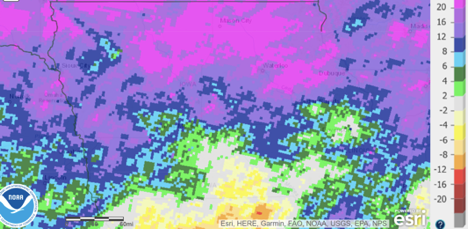
(source: https://water.weather.gov/precip/ parameters from last year versus normal rainfall.)
Unfortunately, this did lead to some areas of drown outs and low yielding areas in fields. Thus, there were many areas that had little if any removals of nutrients but many growers will treat those areas the same as areas that yielded well in the field. This is just one of many examples where VRT and precision agriculture can save the grower on inputs across their farms. It is important to look not just at soil sampling and soil types but also historical yield when deciding on proper recommendations for the field. At Premier Crop, it is important to us to treat every field individually and not look at those fields in a cookie cutter style approach. Premier Crop has an extensive database with over 20 years’ worth of observations.
It is important to look at the return on investment for not just for every field or every acre, but what it is actually taking to produce every bushel. We are able to take all of the costs that are provided and quantify the grower’s yields with those costs. Does it make sense to continue to treat historically poor yielding ground the same as historically high yielding ground? Would your inputs be better spent if focused slightly more on ground that has more yield potential? It is important to us that we treat every acre in an unbiased way, as if we are farming it ourselves, and the data allows us to do that.
The example below shows a field that has been put into three different zones of productivity based upon fertility and historical yield.
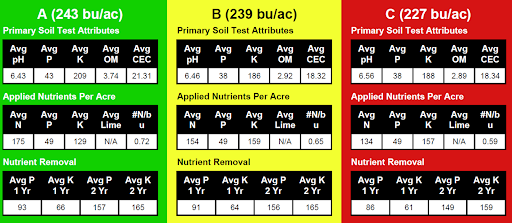
We then break that out further and show how each zone did on a per bushel basis with all the costs entered. As you can see we dropped our rates in the least productive zone because it didn’t show the same ability to produce as the other two management zones.
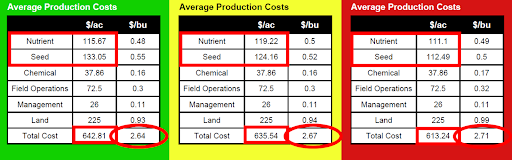
This is a great example how Premier Crop uses data to prove profitability. It's time to stop guessing and use your data to make profitable decisions.
_____________________________________________________________________
Find more relevant posts about data analytics here.