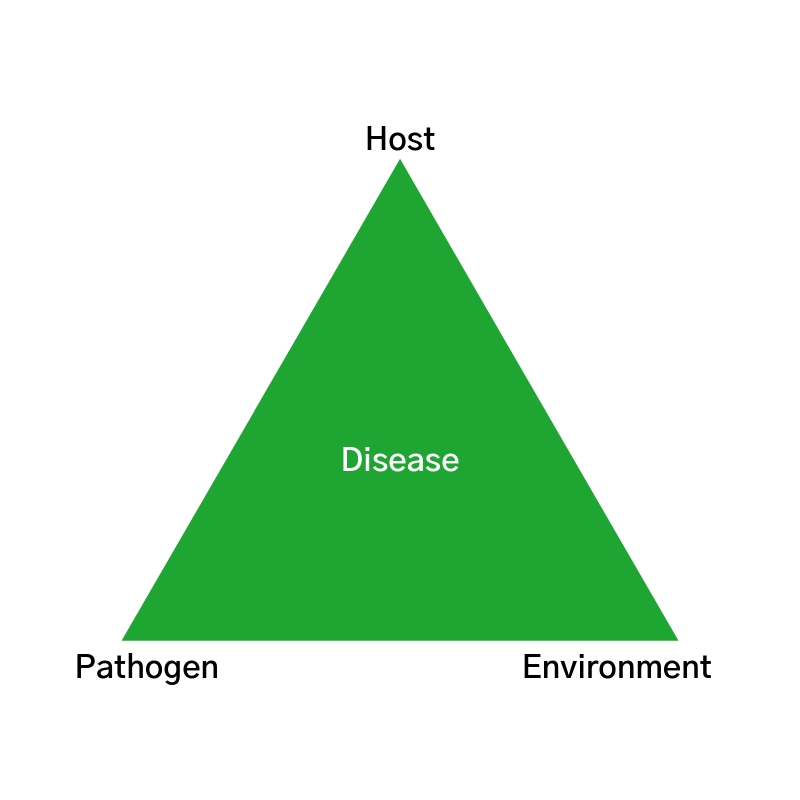
You don’t have to look very hard to find chemical manufacturers’ advertisements claiming a significant positive yield response (15, 20, 25+ bu./ac) to using one of their fungicide products. There are many effective products on the market that provide good control and protection against fungal pathogens, but advertisement claims based on ‘average trial data’ aren’t guarantees for your fields. Three critical components (a host, favorable environment, and pathogen) must come together at the same time for a plant disease to thrive. These three components are commonly referred to as the Plant Disease Triangle. Management or alteration of just one of these components prevents or reduces disease severity.

It’s important to refer back to the Plant Disease Triangle when gauging the need for fungicide application, as well as past local trial results and current crop economic conditions. How do environmental conditions within the field (soil pH, fertility levels, applied nutrients, etc.) affect the vulnerability of the host (corn or soybean plant) as it relates to disease pressures? Is a pH imbalance affecting nutrient uptake, which in turn makes this specific hybrid more susceptible to fungal disease pressure? Does it make sense, economically, to apply fungicide to lower productivity areas within fields? Variability exists in all fields and managing the yield-limiting factors is what will show a yield response come harvest. Agronomy is complex and agronomy is local. Yield response to fungicide fluctuates within each field based on the interactions of many variables, which are all part of the disease triangle. Conducting on-farm fungicide trials generates more agronomic knowledge related to this complex interaction, which improves decision making for future applications.
Being able to use my family’s farm as a ‘testing ground’ makes working with the solutions Premier Crop provides to our partners even more enjoyable. I am able to experience first-hand what many of our partners and advisors put into practice each and every day. Last year I placed a few fungicide Enhanced Learning Blocks (ELBs) in one of our fields to test the effectiveness of a popular fungicide product. An Enhanced Learning Block is a randomized, replicated trial of different rates, products or application timings. ELBs provide a formal testing environment within a field to determine whether or not the treatment had a statistically significant impact on yield.
Trials were setup to be an on/off scenario – 20 gal/ac and 0 gal/ac each replicated 6 times within the trial area (ELB). Two of the ELBs were placed within the same hybrid – one on heavier soil and the other about 800 feet away in lighter soil on a hill. The product was applied at R1 with a Hagie sprayer. Prior to application we had been receiving ample rainfall, so we anticipated potentially higher fungal disease pressure, however that was not the case.
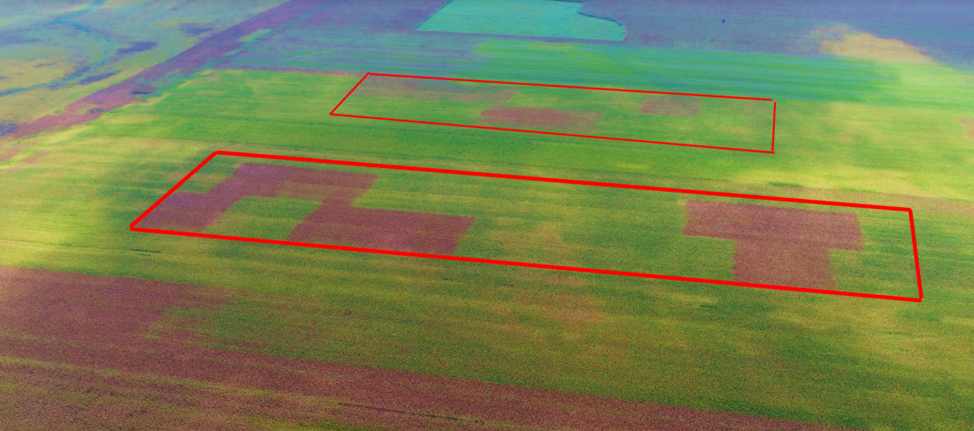
The image below was taken with a drone about one month after application. You can easily see the replicates in the trial area that did not receive any product. Based on the image what do you estimate the yield difference to be between the treated and non-treated rates? What would an imagery solution come up with for a yield difference based off their algorithm calculating yield from NDVI?

As we were harvesting this field we could see the location of the fungicide trials as we worked towards them. While combining in the trials the difference in plant structure was obvious – the tops of the corn plants in the untreated replicates had all broken off. Both the drone image and visual observations at harvest pointed to a significant yield response to fungicide in both trials.
When I received the Enhanced Learning Block trial report I was a bit surprised with the actual results – visual observations are deceiving! One trial had a 1 bu/a yield response and the other was 8 bu/a. I was expecting at least a 15 bushel difference.
#1 – lower ground, heavier soil.
#2 – higher ground, lighter soil.
Why did the trial results end up this way? I have some ideas, but no definite answers. Likely the yield response shown in the trial on lighter soil was due to the treated plants’ improved ability to withstand late-season moisture stress, which wasn’t a yield-limiting factor in the heavier soil environment. What I do know is that a 1 bu/a response didn't come close to paying for the product and application costs, and an 8 bu/a response was likely a little better than break-even. Understanding when, where, and to what degree these products work will allow for better utilization (spatial application), ultimately increasing ROI.
Are we going to spatially apply our fungicide next year? Probably not. Are we going to continue to conduct on-farm trials and Enhanced Learning Blocks to learn more about when, where, and how well fungicides work? Definitely. With the power of local agronomic knowledge, I don’t think it will be too long before spatial application of fungicide becomes a normal practice in crop production.


